Economy
Changing face of China's economy
Updated: 2011-04-18 08:00
By Daryl Guppy (China Daily)
'Trade deficits are not a blip but part of a developing trend'
For the first time in seven years international trade in China has recorded a quarterly trade deficit. This is evidence of the shift in the structure of the Chinese economy but it doesn't signal an end to China's international trade surpluses with the world. It is evidence of an important longer-term trend.
The deficit in March 2010, and again in February 2011, are not just blips in the statistics. It's part of a developing trend, which is a result of sustained efforts to drive and develop domestic demand. The focus on monthly and quarterly figures obscures the larger picture.
China's international trade surplus was at $295 billion in 2008. It dropped in 2009 to $196 billion and then to around $183 billion in 2010. These are still large figures, but the trend is down. Chinese international imports grew by around 32 percent year-on-year in the January-March quarter. China now imports more than the United States on a three-monthly average. By this measure US imports rose by a monthly average of $27 billion and China's monthly average was $33 billion.
|
|

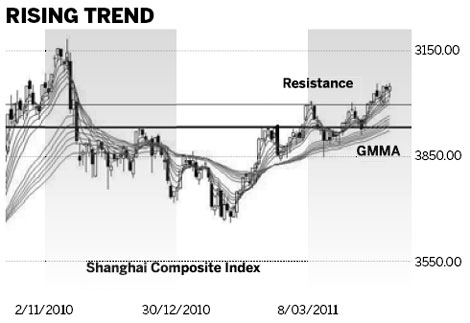
The rising Shanghai index trend has been tested successfully. The test has included two separate features in recent weeks. The success of these different tests has confirmed the strength of the upward trend and also its sustainability. This clears the path to achieve the longer term upside target near 3160.
The first test was the index retreat in March 31. This touched the upper edge of the long-term group of moving averages before developing a rebound. The rebound is important, but even more important is the behavior of the long term Guppy Multiple Moving Average (GMMA).
This group of averages gives guidance to how investors are thinking. If they are confident the retreat is temporary then the investors use this as an opportunity to buy. This is shown in the GMMA indicator display when the long term GMMA does not develop compression when the index retreats. This situation developed on March 31 and clearly indicated investor support for the upward trend.
The second test was the rally above resistance near 3000 followed by an index retreat that used the 3000 level as a new support level. This is an important breakout above the 3000 resistance level. This resistance level drove the market down on March 10 and again on March 29. The strong breakout above this level is bullish.
The successful re-test of this 3000 level, now acting as a support level, is even more bullish. This confirms good trend strength. The market may re-test this level several more times as a support level but this is part of the process of the new upward trend.
Proof of the trend continuation includes three developments.
The first proof is when the upper edge of the long term GMMA moves above the old support level near 2940. This has already developed.
The second proof is when the lower edge of the long term GMMA moves above the 2940 level. This may take several weeks to develop. This slow upward trend confirms the strength and sustainability of the trend.
The third proof of trend strength is when the lower edge of the short term GMMA moves above the 3000 level. This will develop in the next few days. This is evidence of short term upward trend strength. It is significant, but the relationship in the long term GMMA is more important.
The longer term upside target is near 3160. There is a weak resistance level near 3070. The next strong resistance level is near 3160. This means the market can move quickly toward the 3160 level. A fast move is not good for the long-term trend because it is often followed by a rapid retreat. This situation developed in November 2010. In the current situation a retreat from 3160 has the next strong support level near 2900.
The most reliable result for the upward trend is a slow move above 3000 toward resistance near 3160.
The author is a well-known international financial technical analysis expert.
(China Daily 04/18/2011 page14)
E-paper

Han me downs
Traditional 3,000-year-old clothes are making a comeback.
Reaching out
Fast growth fuels rise in super rich
Chinese tourists spend more
European Edition

Specials

Big spenders
More mainland tourists are expected to spend money on overseas travel this year.

Rise in super rich
Report cites rising property prices, gdp as key drivers of increasing number of chinese millionaires.

Reaching out
Condom makers are stepping up their presence in smaller cities to boost sales