Energy
Investors see bullish trend in the price of oil
Updated: 2011-02-28 11:05
By Daryl Guppy (China Daily)
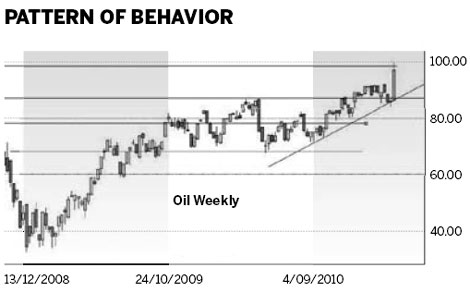
 There are six significant factors to know about the rise in the price of oil when we look at the NYMEX West Texas Crude price chart:
This is a momentum driven rally created by unfolding events in the Middle East;
When the immediate effect of the unrest disappears, oil will return to its long-term trend behavior;
The upward trend in oil started in August 2010;
The $100 price level is a very important psychological barrier in the market;
Trend and resistance behavior creates a powerful chart pattern;
The nature of the oil price trend changes when prices move above $100.
The first feature is the rally. This is created by a rapid upward move in prices. The fast move sometimes includes one or two days where there is a small retreat in prices. The slope of the rally is usually steep, showing the speed of increase in price. The rally often ends with a very rapid collapse of prices to the long-term trend line.
The return to the long-term trend line is the second significant feature of the oil price behavior. The long-term trend is up. The market may slow its rate of climb, but there is a low probability the direction of the market will change when the rally collapses.
Chart analysis of the NYMEX oil chart shows the change in the oil price trend is a long-term market condition. This is the third feature of the current market situation. Starting in October 2009 through to November 2010 the oil price has been trading in a wide sideways pattern. The lower edge of the pattern was near $68. The upper edge of the trading band was near $88. The price oscillated around the central support and resistance level near $78.
The significant change in the trend direction was the development and confirmation of the new upward trend line. This line starts with the August 2010 lows and uses the low in November. The strength and importance of the trend line was tested again in January 2011 when the price dipped below support near $88. The price rebounded from the value of the new upward trend line.
| ||||


Price very quickly moved above this level and tested the $100 mark. The fourth most important feature is that when the price moves above $100 then the next price move is very rapid. The $100 level is a psychological level and the oil price consolidates between the $98 to $100 level.
The combination of the upward trend line and the resistance areas creates an upward sloping triangle pattern. This is the fifth feature of this developing market and it is bullish. The trend line shows increasing upward pressure. The resistance level shows consistent selling pressure. Price action is confirmed between these two powerful market forces. The breakout above the resistance level unleashes a surge of bullish buying.
The upward sloping triangle in the oil market uses the fall in oil price in May 2010 as the base of the triangle pattern. The resistance level near $88 is the upper edge of the triangle pattern. The width of the base of the triangle is calculated and projected upward above resistance near $88. This gives a short-term upside target near $108.
This pattern does not predict the events, which are currently driving the price rally. The pattern points the way to market conditions that are more conducive to this type of reaction when events develop. The current momentum rally toward $100 is the first part of the upward triangle breakout behavior.
The final feature of the oil market is the change in behavior when oil moves above $100. The market develops more momentum behavior. The price moves more rapidly upward. Once this resistance area is broken the price moves very quickly to the higher target levels near $112. This is higher than the price target calculated with the upward sloping triangle. The oil price activity is dominated by support and resistance bands. The price moves between these support and resistance levels. When the price is below $100 the width of the bands is around $10. When the price is above $100 the width of the bands increase to around $12. This gives targets of $112, $124 and, in the longer term, $136.
The behavior around the $100 price level is a critical tipping point for the oil price. The immediate crisis in the Middle East may recede but the long-term oil trend shows continued bullish pressure. The end of the bullish pressure is shown by a close below the upward trend line and also below the support level near $88 and sets a downside target near $78.
The author is a well-known international financial technical analysis expert.
E-paper

Lingua franca
Chinese are learning English on a scale never seen before and the business of teaching is booming.
Preview of the coming issue
Golden run ahead
Looking abroad
European Edition

Specials

NPC & CPPCC sessions
Lawmakers and political advisers gather in Beijing to discuss major issues.

Sentimental journey
Prince William and Kate Middleton returned to the place where they met and fell in love.

Rent your own island
Zhejiang Province charts plans to lease coastal islands for private investments